

Management Reporting Guide: Definition and Tips
Management reporting helps you see what’s really happening in your business. By picking a few key measures, presenting them clearly in simple charts or tables and keeping the data up to date, you’ll spot issues sooner and keep everyone on the same page. In this guide, we’ll explain what managerial reporting looks like, why it matters for your team and share practical tips to get your own reports up and running without fuss.
What Is Management Reporting?
Management reporting refers to the process of creating, analysing and presenting information about various aspects of an organisation's performance in order to enable decision-makers to make well-informed decisions about the future direction of the organization. It’s a fundamental component of corporate performance management, bringing together data, processes and governance to drive strategic alignment.
The main objective is to provide accurate and relevant data to managers, leaders and other decision-makers so that they can make the right decisions that propel the organisation forward towards its set goals.
What Is Included in Management Reporting?
Management reporting involves gathering data from various sources within the organisation, such as financial systems, operational databases, sales statistics and more. Once the data is collected, it is analysed to identify trends and patterns. Various analytical tools and techniques can be used to transform raw data into meaningful information.
Reports
What are management reports? They are tools used to present business performance, progress, and key insights in a clear and actionable format. Based on the analysis, management reports are generated to communicate results to stakeholders across the organisation.
These reports often include dashboards, spreadsheets, graphs, charts, and written summaries. They highlight trends, track KPIs, compare actuals vs. forecasts, and help teams make informed decisions.
Key Performance Indicators (KPIs)
Management reporting often focuses on specific key performance indicators (KPIs) that are relevant to the organisation's goals. These KPIs are metrics that reflect performance in critical areas such as financial performance, operational efficiency, customer satisfaction and employee productivity.
Timely Information
It is essential to receive the right information in a timely manner, enabling decision-makers to respond quickly to new challenges and opportunities.
Clear Communications
Effective managerial reporting involves clearly communicating data and insights. Reports should be easily understandable for non-technical audiences, enabling decision-makers to grasp the implications and take appropriate actions.
Reports can be tailored to the needs of different stakeholders. Senior management may require high-level summaries, while department heads may need more detailed operational insights.
Continuous Improvement
Management reporting is not a one-time activity; it is an ongoing process that requires continuous refinement. As business conditions change, you’ll want to evolve not only your KPIs but also your plans, leveraging scenario planning to stress-test forecasts and stay ahead of whatever comes next.
Strategic Decision-Making
Management reporting for businesses forms the foundation for strategic decision-making. By understanding trends and areas for improvement, organisations can make the right decisions to optimise their operations and achieve their goals.
Technology and Tools
Since spreadsheets pose security risks, many organisations use specialised software and tools for data collection, analysis and reporting. These tools can help streamline the reporting process and provide more accurate and up-to-date information.
Tips on Preparing Your Management Reports
Here is how to create management reports that are actionable:
1. Include Insights That Drive Performance
According to a Deliotte management reporting survey only 24% of time is spent on analysis of reports and the reason is that companies are spending more time on low value-added activities.
By finding valuable insights in your reports, it’s much easier to make the right decisions. Take your time and analyse and prepare your reports with both internal and external insights that provide value for your organisation.
2. Create Reports That Are Easy to Read
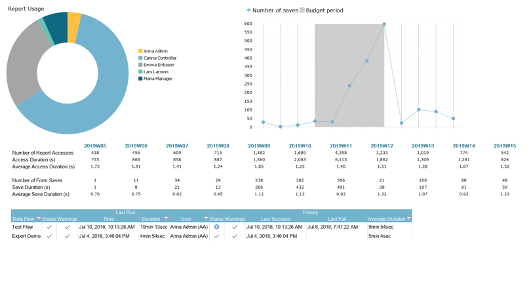
Use dashboards and charts that visualize your data in a clear way. Only present the essentials in your reports and if the management team asks for more information make sure to create a report that’s drillable to source transactional data. Keep it simple by only showing the most important KPI:s.
Below you’ll find an example of a report from Mercur Business Control:
3. Collaborative Reports
With all your information in one single solution, it’s much easier to collaborate. Create reports that you can share with other departments within the organisation. This way, it will be easier for you and your colleagues to find valuable insights from your monthly management reports. Create reports that are accessible at any time and keep them up to date with real-time data.
How Mercur’s Management Reporting Software Can Help
Mercur Business Control is one of the leading solutions for management reporting. In our cloud-based application you can connect multiple data sources, collaborate in your reports, 'capture forecasts and narrative' and deliver your insights. By encouraging a data-driven organization it's easier to make improved informed decisions and at the same time focus on your business growth. We’ve helped 1000 of Mercur Business Control users manage cost and grow profits for over 40 years. Read about Hellman and how they manage performance in 56 countries in real time.
Frequently Asked Questions
What is management vs. financial reporting?
Management reporting is internal, forward-looking analyses, such as dashboards, KPIs, budgets, variance and project updates, to drive decisions and performance. Financial reporting is external, backward-looking, standardised statements, such as balance sheet, income statement and cash flow.
What are the different types of management reports?
Common management reports include KPI dashboards (sales, operations, customer metrics), budget vs. actual analyses, variance reports, project status and risk logs, resource and HR utilisation, cash-flow forecasts, sales pipeline reviews, marketing performance and ad-hoc analytical studies.
Get in touch for more information!
 Blog
BlogAI in Financial Planning: Trends and Next Steps
Discover how finance teams are using AI to drive smarter planning, faster insights, and stronger business decisions.
- Blog
Why xP&A is a powerful game-changer
The newest iteration of planning, analysis and reporting systems is a powerful game-changer that unites company departments and boosts competitiveness. It’s called xP&A – the abbreviation of extended financial planning and analysis.
- Blog
How to get accurate financial reports without waiting for month-end
You don't need to wait until month-end to see accurate financial reports. With modern financial systems you can access up-to-date reports whenever you need them.
- Blog
3‑Statement Model for Better Financial Forecasting
Financial forecasting is critical for any business that wants to adapt to change. But finance teams keep usingfragmented models and manual processes. The 3-statement financial model is the solution.
- Blog
Why is our Excel-based budget always out of date?
Excel creates outdated budgets. Every time someone enters a figure, sends a file, or waits for another department to finish their section, your budget falls further behind reality.
- Blog
Spreadsheets Risk the Future of the Business
Spreadsheets often start as just a list for storing information and there is minimal process documentation, support or maintenance for these worksheets. Despite the fact that desktop applications such as Microsoft Office are included in the standard configuration of users' PCs, very little formal training is ever given to spreadsheet users.
- Blog
Cash Flow Forecasting
Inaccurate cash flow forecasting can be a costly mistake for companies. In today’s volatile market, relying on static annual budgets or manual spreadsheets leaves financial leaders without the agility to respond to uncertainty.
- Blog
What is management reporting?
Management Reporting refers to the process of creating, analyzing, and presenting information about various aspects of an organization's performance to enable decision-makers to make well-informed decisions about the future.
- Blog
Save time and create a successful budget process
If you’re working in a large organization, you’re probably aware of how time-consuming the budget process can be. In this article we’ll give you tips on how to save time and still create a successful budget process
- Blog
How to succeed with your planning, budgeting, and forecasting process
We know it can be challenging to succeed with your planning, budgeting, and forecasting process. Therefore, we have gathered our best tips for you to succeed!
- Blog
Business Budgeting Software: How to Choose the Right One
Choosing budgeting software is partly a finance and partly a strategic decision. The right tool helps organisations organise planning cycles, adapt as the market changes and increase accountability across departments. But not every platform will be a good fit.
- Blog
Five tips for a successful budget process!
How can you make your budget process more successful and maximise the effort that was invested in creating it? Of course, there are many factors to consider but we’ve chosen to highlight five key areas that will enable and help you create a smoother, value-creating and collaborative budget process.
- Blog
Better Revenue Planning
Sales forecasting is the process of predicting future revenue based on past data and trends. Read the blog to learn the best methods to do it right.
- Blog
Risks with working in spreadsheets
Spreadsheets are an essential tool for all types of organisations and businesses rely on them heavily, particularly for financial computations. The most popular spreadsheet program globally is, of course, Microsoft Excel, it’s used by an estimated 750 million people.
- Blog
How to Effectively Budget with Driver-Based Forecasting
Traditional models of forecasting rely on historical data and beliefs. It uses techniques that identify patterns, which are simple to use. However, with these methods, there are some challenges because they are not dynamic with today’s market, and can’t effectively analyse complex data.
- Blog
The Collaborative, Smarter Budget
In many organisations manual budgeting processes over-burden staff and create masses of data which overwhelms department heads and stops them seeing the bigger picture.
- Blog
Scenario Planning - Better control during uncertain times
Uncertain times create the need for more frequent forecasts and time for analyzing and comparing different future scenarios. We give you 5 tips on how to simulate future scenarios using scenario planning
- Blog
The Hidden Cost of Data Silos
If you ever feel like your teams speak different languages when it comes to data, it is a classic symptom of data silos. The information gets stuck in one department, system or tool, making it difficult for anyone to see the full picture.
- Blog
Budgeting in a modern world
Thirty years after its debut, Microsoft Excel is still the preferred tool for budgeting and planning projects. However, its popularity is declining, due in most part to the rise of technology and subscription-based pricing for a myriad of SaaS-based products.
- Blog
Business Intelligence Reporting For Finance Teams
The real challenge today isn’t collecting data, it’s making sense of it and fast. Organisations turn to business intelligence (BI) to convert raw data into insight.But how do you actually do it right?
- Blog
Boost Report Readability, Engagement, and Decision-Making
In today’s fast-paced business environment, effective reports and dashboards are crucial for decision-making. Our user study using eye-tracking technology revealed seven key insights into what captures attention.
- Blog
How can AI help CFOs make better decisions?
Artificial Intelligence (AI) has significant potential to enhance decision-making for Chief Financial Officers (CFOs) by providing data-driven insights, automating routine tasks, and enabling more accurate forecasts.
- Blog
Top-Down vs Bottom-Up Budgeting
Budgeting aligns resources with strategic goals, and there are two primary approaches: top-down and bottom-up. Which method wroks best?
- Blog
AI and Machine Learning, what is it, and why is it important for the future?
Artificial Intelligence and Machine Learning, what is it, and what is the difference?
- Blog
AI in Finance as a Powerful Tool
In this post, we explore how AI is evolving from a theoretical concept into a valuable resource for decision-making. Get useful insights for finance teams at any stage, from early exploration to actively using AI-powered solutions.
- Blog
Informed Business Decisions at Maximum Velocity
The ability to process information swiftly is essential. If your business can’t manage your data efficiently, your company’s financial performance will surely underperform. At Mercur we have developed our own database Veloxic which helps Financial Planning and Analysis.
- Blog
CFO Playbook - KPIs for 2026
The role of the CFO is changing fast. Today, the finance function is expected to deliver more than reports — it must drive direction, speed and profitability through clear, actionable KPIs. Learn more in this guide.
- Blog
How do finance teams track KPIs across the entire organisation?
Learn how finance teams track KPIs across the entire organisation by consolidating data from multiple sources into a unified system like Mercur.
- Blog
Zero-Based vs. Incremental Budgeting
Budgeting sits at the heart of sound financial management. This is why choosing the right technique is crucial for CFOs – it shapes resource allocation, cost control and strategic agility. Incremental and zero-based budgeting are two leading methods that offer distinct approaches.
- Blog
The Role of the CFO: Top Priorities and Responsibilities
Today's finance leaders steer more than just budgets and reports. The digital transformation ramps up with the increase of corporate complexity, and so does the role of CFOs.
- Blog
What Is FP&A? Definition, Purpose, and Best Practices
Without solid financial planning and analysis (FP&A), businesses operate in the dark. In this post we go deeper into the process of FP&A and why it’s important for businesses.
- Blog
The Business Benefits of Integrated Business Planning
This blog explores what IBP is and the typical IBP process. We highlight business benefits and how the right software can be a game-changer for your organisation.
- Blog
AI in corporate budgeting
Artificial Intelligence (AI) can support decision making in key areas such as budgeting, capital allocation and even corporate strategy and as a result, it is increasingly being deployed in corporate performance management tools (CPM).
- Blog
What Is Planning, Budgeting and Forecasting?
Planning, budgeting and forecasting are rarely static. Shifts in the industry often require you to revisit assumptions, adjust targets and adopt new processes. Learn how to strengthen your approach and stay ahead of change.
- Blog
How To Create a Successful Budgeting Process
When done well, budgeting helps organisations stay financially on course, even when things don’t go exactly as planned. Learn how to keep things on track so you avoid surprises and stay focused on your goals.
- Blog
Spreadsheet Risk Management: Best Practices for 2025
Excel has long been a target for hackers; just one click on a malicious attachment can infect your entire network. So, how can you keep using spreadsheets while not sacrificing your safety?
- Blog
How Automated Reporting Will Transform FP&A in 2026
This article highlights the power of report automation, how to implement it in your business and explores any new opportunities for accurate financial analysis in the long run.
- Blog
Best Guide to Improve Your Revenue with Flexible Budgeting
Optimise your expenses with flexible budgeting, and learn how to adjust budget to reflect current business activities, market changes and cost fluctuations.
- Blog
Top 7 Manager KPIs for Financial and Operational Success
In today's post we'll break down why KPIs matter, which ones offer the most insight for finance and executive teams and how to ensure they're actually driving results.
- Blog
Top PowerBI Alternatives in 2025
Explore the top PowerBI alternatives for 2025. Discover how Mercur delivers integrated planning, budgeting and reporting without the high cost and complexity.
- Blog
FP&A Trends Shaping Financial Planning in 2025
Many organisations cope with fragmented planning and data quality issues, which slow down their forecasting cycles. This forces organisations to take practical steps to turn ambition into execution.
- Blog
Rolling Forecasts: Practical Steps, Benefits, and How to Get Started
Financial planning has changed. Traditional annual budgets can’t keep up with rapid shifts in the market, evolving customer needs, and internal performance dynamics. That’s why many finance teams are turning to a rolling forecast model.
- Blog
Mastering Spreadsheets
Where many businesses start small, a simple spreadsheet can adequately perform the limited tasks required of it. As the company grows, your spreadsheets can get more complex and harder to manage, by which point it feels like it will be too difficult to move to a different reporting tool.
- Blog
Spreadsheets are not Collaborative Tools
Spreadsheets were never designed for collaboration, yet they are the single most used program among teams and co-workers. They often start out as a quick document for storing, formatting or calculating information but evolve into important documents and are often the core records for an organisation.
- Blog
How EPM Transforms Financial Planning and Forecasting
Struggling to keep plans aligned in a changing market? Discover how EPM helps finance teams move faster, stay accurate and lead with real-time insights.
- Blog
A practcial guide to scenario planning
Scenario planning gives you a clear, practical way to test assumptions, spot risks and opportunities, and make better strategic choices so your organisation stays resilient when conditions change.
- Blog
Variance Analysis: A Comprehensive Guide
Senior executives are demanding more detail in their management reports. The amount of data available to finance departments has exploded and decision makers see this as an opportunity to get more insight into how the business is performing.
- Blog
What is Corporate Performance Management? (CPM)
CPM, or Corporate Performance Management, is a process within corporate management aimed at measuring and optimizing the performance of an organization. CPM encompasses a range of activities, including budgeting, planning, forecasting, reporting, and analysis.
- Blog
Balancing Profitability and Sustainability
Sustainability has become a central concern for organisations across the world — and the UK is no exception. This evolving landscape places new demands on financial reporting.
- Blog
The Powerhouse of EPM Tools
A business’s success heavily relies on having a strong strategy. However, what's even more important is implementing that strategy while tracking and measuring the performance. This can easily be done by investing in enterprise performance management (EPM) software.
- Blog
Build Long-Range Planning for Business Success
Discover how effective long-range planning aligns strategy, finance and operations for smarter decisions and sustainable growth.
- Blog
From static budgets to agile financial management
Traditional budgeting has long been the cornerstone of financial planning in businesses. But today it can become more of a limitation than a strength. That’s where the concept of Beyond Budgeting comes in.
Mercur Solutions (UK) Limited - UK office
Mercur Solutions Limited
Lily Hill Court, Lily Hill Road, Bracknell, RG12 2SJ
United Kingdom
+44 (0) 1344 388 025
Mercur Solutions AB - head office in Sweden
Mercur Solutions AB
Vretenvägen 13
SE-171 54 Solna
+46 (0)-459 69 00
Malmo Office
Rundelsgatan 16
SE-211 36 Malmö
Gothenburg
Västra Hamngatan 21
SE-411 17 Göteborg
Links
Mercur Solutions
A Swedish company with 50 years of experience, delivering solutions for performance management and business intelligence.