.png?TS=638820438335910511)
How to Build Better Business Intelligence Reporting for Smarter Financial Decisions
Companies today face a flood of data - from operations and sales to supply chain, HR, and beyond. But the real challengeisn’t collecting it, it’s making sense of it, fast. That’s where business intelligence reporting comes in.
Rather than relying on gut instinct or outdated spreadsheets, organisations now turn to business intelligence (BI) to convert raw data into insight. If done well, it supports better forecasting, strengthens accountability, and helps leaders make decisions with confidence. But how do you actually do it right? Let’s break it down.
What Is Business Intelligence Reporting?
Business intelligence reporting refers to the process of collecting, analysing and presenting business data to inform decision-making. It typically involves using software tools to create dashboards, visualisations and reports that reflect what’s happening across departments.
The goal is to support strategic decisions using reliable, timely data, not just generate nice-looking charts. Good BI reporting answers real questions: Which products are underperforming? Are we meeting targets? Where are costs drifting out of control?
To make it workyou need more than technology. You need clear thinking, collaboration between teams and a commitment to improving how data is used.
Step 1: Start with Strategy, Not Spreadsheets
Start with the business need, not the data. Too many reporting projects begin with questions like “What can we measure?” instead of “What do we need to understand?”
You’ll get far better results if you reverse that. Talk to stakeholders, CFOs, heads of departments, team leaders, and find out what insights they lack. Do they need a better grip on project costs? More visibility over customer churn? Tighter forecasting around cash flow?
The value of business intelligence reporting lies in how it answers those questions. If you can’t connect each report back to a decision someone needs to make, you risk wasting time building dashboards no one reads.
Step 2: Break Down Data Silos
The next step is getting your data in order. Most organisations use a mix of systems for finance, sales, HR and operations. These often don’t talk to each other. That’s where BI software comes in, helping you unify data in one place, so you can analyse performance across the business.
You need to make sure your data is clean, consistent and structured. Otherwise, reports won’t be trusted. That means checking for duplicate entries, agreeing on naming conventions, and aligning metrics across teams.
A system like Mercur Business Control makes this easier by integrating budgeting, forecasting and reporting. It supports transactional-level detail and allows finance teams to create dashboards, automate reports and run scenario analysis, all from a single source of truth.
Step 3: Focus on KPIs That Move the Needle
With data in place, focus on building reports that track what matters most. Don’t try to track everything, you’ll overwhelm the audience and bury key insights.
Instead, work with teams to define KPIs that align with strategic goals. These might include:
Gross margin by product or region
Budget vs actuals over time
Variance in revenue forecasts
Operational cost breakdowns
Customer lifetime value
Each department may have its own KPIs, but make sure there’s a consistent structure and logic behind what’s reported. If different teams define “customer churn” in different ways, reporting quickly loses credibility.
Stick to clean, relevant visualisations, like bar charts, line graphs, and tables. Avoid overcomplicating things. A good report makes patterns obvious, flags problems early, and helps managers act without needing extra explanation.
Step 4: Use Dashboards for Real-Time Monitoring
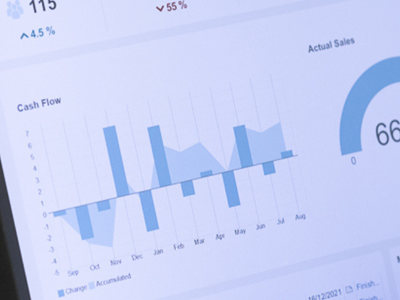
One of the biggest shifts in business intelligence reporting is moving from monthly static reports to real-time dashboards. Instead of waiting for an email or PowerPoint, users can log into a platform and explore data on demand.
Interactive dashboards allow users to:
Filter by department, time period or region
Drill into individual transactions or exceptions
Compare actuals against budgets and forecasts
Test out different assumptions using built-in scenarios
This empowers decision-makers to get answers faster and respond to issues sooner. For example, if costs in a particular department start to spike mid-month, managers can spot the trend and intervene before it escalates.
Make sure dashboards are tailored to the audience. Executives may want high-level overviews, while analysts or finance leads might need detailed breakdowns. Every dashboard should have a clear purpose. If someone can’t explain why it exists, it probably isn’t needed.
Step 5: Look Forward with Forecasts and What-If Analysis
Reporting shouldn’t only look backwards. While understanding past performance is important, you also want to explore what might happen next.
This is where forecasting and scenario planning become valuable. By linking historical data with assumptions about the future, you can build rolling forecasts, spot trends early, and test different outcomes.
For example, you might want to know:
What happens if sales drop by 10% next quarter?
How will a price increase affect profitability?
Can we afford a headcount expansion in Q4?
Solutions like Mercur make this kind of analysis easier, as they allow you to model different scenarios within the same environment you use for budgeting and reporting. It means you’re not jumping between spreadsheets or retyping formulas.
Scenario-based planning helps leaders prepare, not just react. This is a major benefit in uncertain markets.
Step 6: Review and Refine Regularly
No report is perfect forever. As your business changes, so do your priorities. A dashboard that made sense six months ago might be outdated now.
That’s why you need a process for reviewing and improving business intelligence with reporting. Schedule time each quarter to assess which reports are being used, which ones are ignored, and what new questions have emerged.
It’s also smart to monitor ad hoc report requests. If the same queries keep coming up, you may want to build them into regular dashboards. This reduces manual work and makes sure people always have access to the insights they need.
Gather feedback from end users as well. Ask if reports are clear, relevant and timely. Sometimes, a small change, like renaming a chart or reordering sections, can make a big difference to how useful a report is.
Step 7: Make Reporting a Team Sport
Finally, don’t treat reporting as something only finance or IT handles. Great reporting happens when finance, commercial teams and operations work together.
Encourage teams to discuss reports in meetings, share dashboards, and build a culture where data backs up decisions. Train users where needed and make it easy to access the right information without needing specialist help.
The best BI systems are self-serve, not locked behind one team. When everyone in the organisation can explore data, ask smart questions and test ideas, reporting stops being a burden and becomes a habit.
Key Takeaways for Finance Teams
Business intelligence reporting is about equipping your organisation to make better decisions, faster. That means starting with the right questions, connecting reliable data, and creating reports that people trust and use. With the right mindset and the right tools, reporting becomes more than a monthly routine. It becomes a strategic asset.
If you’re looking to improve your approach to business reporting, systems like Mercur offer a flexible, integrated way to bring planning, analysis and forecasting together. It could be the change that turns your reporting from reactive to proactive.
Ready to see smarter reporting in action? Book a demo with Mercur and discover how we help finance teams turn insight into impact.
 Blog
BlogBudgeting in a modern world
Thirty years after its debut, Microsoft Excel is still the preferred tool for budgeting and planning projects. However, its popularity is declining, due in most part to the rise of technology and subscription-based pricing for a myriad of SaaS-based products.
 Blog
BlogAI in corporate budgeting
Artificial Intelligence (AI) can support decision making in key areas such as budgeting, capital allocation and even corporate strategy and as a result, it is increasingly being deployed in corporate performance management tools (CPM).
 Blog
Blog3‑Statement Model for Better Financial Forecasting
Financial forecasting is critical for any business that wants to adapt to change. But finance teams keep usingfragmented models and manual processes. The 3-statement financial model is the solution.
 Blog
BlogA practcial guide to scenario planning
Scenario planning gives you a clear, practical way to test assumptions, spot risks and opportunities, and make better strategic choices so your organisation stays resilient when conditions change.
 Blog
BlogFP&A Trends Shaping Financial Planning in 2025
Many organisations cope with fragmented planning and data quality issues, which slow down their forecasting cycles. This forces organisations to take practical steps to turn ambition into execution.
 Blog
BlogWhat is Corporate Performance Management? (CPM)
CPM, or Corporate Performance Management, is a process within corporate management aimed at measuring and optimizing the performance of an organization. CPM encompasses a range of activities, including budgeting, planning, forecasting, reporting, and analysis.
 Blog
BlogWhat is management reporting?
Management Reporting refers to the process of creating, analyzing, and presenting information about various aspects of an organization's performance to enable decision-makers to make well-informed decisions about the future.
 Blog
BlogRolling Forecasts: Practical Steps, Benefits, and How to Get Started
Financial planning has changed. Traditional annual budgets can’t keep up with rapid shifts in the market, evolving customer needs, and internal performance dynamics. That’s why many finance teams are turning to a rolling forecast model.
 Blog
BlogWhy xP&A is a powerful game-changer
The newest iteration of planning, analysis and reporting systems is a powerful game-changer that unites company departments and boosts competitiveness. It’s called xP&A – the abbreviation of extended financial planning and analysis.
 Blog
BlogBest Guide to Improve Your Revenue with Flexible Budgeting
Optimise your expenses with flexible budgeting, and learn how to adjust budget to reflect current business activities, market changes and cost fluctuations.
 Blog
BlogCash Flow Forecasting
Inaccurate cash flow forecasting can be a costly mistake for companies. In today’s volatile market, relying on static annual budgets or manual spreadsheets leaves financial leaders without the agility to respond to uncertainty.
 Blog
BlogZero-Based vs. Incremental Budgeting
Budgeting sits at the heart of sound financial management. This is why choosing the right technique is crucial for CFOs – it shapes resource allocation, cost control and strategic agility. Incremental and zero-based budgeting are two leading methods that offer distinct approaches.
 Blog
BlogWhy is our Excel-based budget always out of date?
Excel creates outdated budgets. Every time someone enters a figure, sends a file, or waits for another department to finish their section, your budget falls further behind reality.
 Blog
BlogThe Powerhouse of EPM Tools
A business’s success heavily relies on having a strong strategy. However, what's even more important is implementing that strategy while tracking and measuring the performance. This can easily be done by investing in enterprise performance management (EPM) software.
 Blog
BlogHow to get accurate financial reports without waiting for month-end
You don't need to wait until month-end to see accurate financial reports. With modern financial systems you can access up-to-date reports whenever you need them.
 Blog
BlogAI in Finance as a Powerful Tool
In this post, we explore how AI is evolving from a theoretical concept into a valuable resource for decision-making. Get useful insights for finance teams at any stage, from early exploration to actively using AI-powered solutions.
 Blog
BlogHow to Effectively Budget with Driver-Based Forecasting
Traditional models of forecasting rely on historical data and beliefs. It uses techniques that identify patterns, which are simple to use. However, with these methods, there are some challenges because they are not dynamic with today’s market, and can’t effectively analyse complex data.
 Blog
BlogHow EPM Transforms Financial Planning and Forecasting
Struggling to keep plans aligned in a changing market? Discover how EPM helps finance teams move faster, stay accurate and lead with real-time insights.
 Blog
BlogHow do finance teams track KPIs across the entire organisation?
Learn how finance teams track KPIs across the entire organisation by consolidating data from multiple sources into a unified system like Mercur.
 Blog
BlogThe Hidden Cost of Data Silos
If you ever feel like your teams speak different languages when it comes to data, it is a classic symptom of data silos. The information gets stuck in one department, system or tool, making it difficult for anyone to see the full picture.
 Blog
BlogRisks with working in spreadsheets
Spreadsheets are an essential tool for all types of organisations and businesses rely on them heavily, particularly for financial computations. The most popular spreadsheet program globally is, of course, Microsoft Excel, it’s used by an estimated 750 million people.
 Blog
BlogBalancing Profitability and Sustainability
Sustainability has become a central concern for organisations across the world — and the UK is no exception. This evolving landscape places new demands on financial reporting.
 Blog
BlogBetter Revenue Planning
Sales forecasting is the process of predicting future revenue based on past data and trends. Read the blog to learn the best methods to do it right.
 Blog
BlogThe Business Benefits of Integrated Business Planning
This blog explores what IBP is and the typical IBP process. We highlight business benefits and how the right software can be a game-changer for your organisation.
 Blog
BlogVariance Analysis: A Comprehensive Guide
Senior executives are demanding more detail in their management reports. The amount of data available to finance departments has exploded and decision makers see this as an opportunity to get more insight into how the business is performing.
 Blog
BlogHow To Create a Successful Budgeting Process
When done well, budgeting helps organisations stay financially on course, even when things don’t go exactly as planned. Learn how to keep things on track so you avoid surprises and stay focused on your goals.
 Blog
BlogBusiness Budgeting Software: How to Choose the Right One
Choosing budgeting software is partly a finance and partly a strategic decision. The right tool helps organisations organise planning cycles, adapt as the market changes and increase accountability across departments. But not every platform will be a good fit.
 Blog
BlogAI in Financial Planning: Trends and Next Steps
Discover how finance teams are using AI to drive smarter planning, faster insights, and stronger business decisions.
 Blog
BlogManagement Reporting Guide: Definition and Tips
Management reporting helps you see what’s really happening in your business. In this guide, we’ll explain what managerial reporting looks like and share practical tips.
 Blog
BlogAI and Machine Learning, what is it, and why is it important for the future?
Artificial Intelligence and Machine Learning, what is it, and what is the difference?
 Blog
BlogSpreadsheets are not Collaborative Tools
Spreadsheets were never designed for collaboration, yet they are the single most used program among teams and co-workers. They often start out as a quick document for storing, formatting or calculating information but evolve into important documents and are often the core records for an organisation.
 Blog
BlogSave time and create a successful budget process
If you’re working in a large organization, you’re probably aware of how time-consuming the budget process can be. In this article we’ll give you tips on how to save time and still create a successful budget process
 Blog
BlogSpreadsheets Risk the Future of the Business
Spreadsheets often start as just a list for storing information and there is minimal process documentation, support or maintenance for these worksheets. Despite the fact that desktop applications such as Microsoft Office are included in the standard configuration of users' PCs, very little formal training is ever given to spreadsheet users.
 Blog
BlogThe Collaborative, Smarter Budget
In many organisations manual budgeting processes over-burden staff and create masses of data which overwhelms department heads and stops them seeing the bigger picture.
 Blog
BlogTop-Down vs Bottom-Up Budgeting
Budgeting aligns resources with strategic goals, and there are two primary approaches: top-down and bottom-up. Which method wroks best?
 Blog
BlogBoost Report Readability, Engagement, and Decision-Making
In today’s fast-paced business environment, effective reports and dashboards are crucial for decision-making. Our user study using eye-tracking technology revealed seven key insights into what captures attention.
 Blog
BlogBuild Long-Range Planning for Business Success
Discover how effective long-range planning aligns strategy, finance and operations for smarter decisions and sustainable growth.
 Blog
BlogTop 7 Manager KPIs for Financial and Operational Success
In today's post we'll break down why KPIs matter, which ones offer the most insight for finance and executive teams and how to ensure they're actually driving results.
 Blog
BlogMastering Spreadsheets
Where many businesses start small, a simple spreadsheet can adequately perform the limited tasks required of it. As the company grows, your spreadsheets can get more complex and harder to manage, by which point it feels like it will be too difficult to move to a different reporting tool.
 Blog
BlogScenario Planning - Better control during uncertain times
Uncertain times create the need for more frequent forecasts and time for analyzing and comparing different future scenarios. We give you 5 tips on how to simulate future scenarios using scenario planning
 Blog
BlogSpreadsheet Risk Management: Best Practices for 2025
Excel has long been a target for hackers; just one click on a malicious attachment can infect your entire network. So, how can you keep using spreadsheets while not sacrificing your safety?
 Blog
BlogThe Role of the CFO: Top Priorities and Responsibilities
Today's finance leaders steer more than just budgets and reports. The digital transformation ramps up with the increase of corporate complexity, and so does the role of CFOs.
 Blog
BlogInformed Business Decisions at Maximum Velocity
The ability to process information swiftly is essential. If your business can’t manage your data efficiently, your company’s financial performance will surely underperform. At Mercur we have developed our own database Veloxic which helps Financial Planning and Analysis.
 Blog
BlogFrom static budgets to agile financial management
Traditional budgeting has long been the cornerstone of financial planning in businesses. But today it can become more of a limitation than a strength. That’s where the concept of Beyond Budgeting comes in.
 Blog
BlogFive tips for a successful budget process!
How can you make your budget process more successful and maximise the effort that was invested in creating it? Of course, there are many factors to consider but we’ve chosen to highlight five key areas that will enable and help you create a smoother, value-creating and collaborative budget process.
 Blog
BlogHow can AI help CFOs make better decisions?
Artificial Intelligence (AI) has significant potential to enhance decision-making for Chief Financial Officers (CFOs) by providing data-driven insights, automating routine tasks, and enabling more accurate forecasts.
 Blog
BlogHow to succeed with your planning, budgeting, and forecasting process
We know it can be challenging to succeed with your planning, budgeting, and forecasting process. Therefore, we have gathered our best tips for you to succeed!
 Blog
BlogCFO Playbook - KPIs for 2026
The role of the CFO is changing fast. Today, the finance function is expected to deliver more than reports — it must drive direction, speed and profitability through clear, actionable KPIs. Learn more in this guide.
 Blog
BlogWhat Is Planning, Budgeting and Forecasting?
Planning, budgeting and forecasting are rarely static. Shifts in the industry often require you to revisit assumptions, adjust targets and adopt new processes. Learn how to strengthen your approach and stay ahead of change.
 Blog
BlogHow Automated Reporting Will Transform FP&A in 2026
This article highlights the power of report automation, how to implement it in your business and explores any new opportunities for accurate financial analysis in the long run.
 Blog
BlogWhat Is FP&A? Definition, Purpose, and Best Practices
Without solid financial planning and analysis (FP&A), businesses operate in the dark. In this post we go deeper into the process of FP&A and why it’s important for businesses.
 Blog
BlogTop PowerBI Alternatives in 2025
Explore the top PowerBI alternatives for 2025. Discover how Mercur delivers integrated planning, budgeting and reporting without the high cost and complexity.


