.jpg?TS=638985321009648131)
How do finance teams track KPIs across the entire organization?
Finance teams track KPIs across the entire organisation by consolidating data from multiple sources into a unified system that provides real-time visibility into performance metrics. This involves integrating ERP, HR, sales, and production systems to create dashboards and reports that monitor key indicators across all departments. Effective organisational KPI tracking requires automated data consolidation, role-based access for different stakeholders, and tools that allow finance teams to drill down from summary metrics to detailed transactions when investigating variances.
What does it actually mean to track KPIs across an entire organisation?
Tracking KPIs across an organisation means creating a consolidated view of performance metrics from every department, business unit, and function. You're pulling data from sales, production, HR, finance, and operations into one place where you can monitor progress against targets, spot trends, and understand how different parts of the business contribute to overall performance.
This goes far beyond collecting isolated departmental metrics. When you track KPIs organisationally, you're building cross-departmental visibility that shows how performance in one area affects another. Your sales team's revenue numbers connect to production capacity, which links to HR headcount planning, which ties back to financial targets.
For financial leadership, this matters because you need to see the complete picture when making decisions. When you're running scenario analyses or adjusting forecasts, you can't work with fragmented data from disconnected sources. You need a single version of truth that shows actual results alongside targets across every level of your organisation, from individual transactions right up to consolidated group performance.
Why do finance teams struggle with tracking KPIs across different departments?
Finance teams face several persistent challenges when attempting to monitor performance metrics across the entire organisation:
Disconnected systems create data silos – Financial data sits in the ERP, HR metrics exist in separate workforce systems, production numbers come from manufacturing software, and sales figures live in the CRM, making consolidation a manual and time-consuming process
Spreadsheet dependency causes version control nightmares – When different departments track KPIs in separate Excel files, you end up with conflicting versions, uncertainty about which numbers reflect current reality, and hours wasted reconciling differences
Delayed reporting cycles produce outdated information – By the time you've gathered data from every department, consolidated everything, and checked for errors, the numbers are already weeks old, forcing you to make decisions based on historical rather than current performance
Inconsistent definitions undermine data accuracy – Marketing calculates customer acquisition cost one way, sales tracks it differently, and finance uses yet another method, creating discrepancies that erode confidence in the metrics you're monitoring
These challenges compound each other, creating a situation where finance teams spend more time wrestling with data quality and consolidation issues than actually analysing performance and providing strategic insights. The lack of integration between systems means that even basic reporting becomes a labour-intensive exercise, whilst the absence of standardised definitions makes cross-departmental comparisons unreliable at best.
How do you set up a system that tracks KPIs across multiple departments?
Setting up effective organisational KPI tracking starts with identifying which metrics actually matter for your strategic goals. Work with department heads to determine the performance indicators that drive business outcomes, not just the metrics that are easy to measure. Focus on KPIs that connect to financial performance and operational efficiency across the organisation.
You need to integrate data from various sources into a single platform that serves as your source of truth. This means connecting your ERP system with HR, production, sales, and other operational systems so data flows automatically rather than requiring manual exports and imports. The integration should pull detailed transactional data, not just summary figures, so you can drill down when investigating variances.
Establish automated data consolidation that updates regularly rather than waiting for manual refresh cycles. Your KPI tracking system should sync data continuously or at scheduled intervals, giving you near-real-time visibility into performance. This eliminates the delays that come from waiting for teams to submit their numbers and for finance to consolidate everything manually.
Set up dashboards tailored to different stakeholder needs. Your CFO needs a high-level view of financial and operational KPIs across the entire organisation. Department heads need detailed metrics for their areas with the ability to compare against targets and historical performance. Finance team members need access to underlying data so they can investigate anomalies and validate figures.
Build in drill-down functionality so users can trace KPIs from summary level down to individual transactions. When someone spots a variance in a dashboard, they should be able to click through to see the detailed data behind that number, whether that's individual invoices, orders, or journal entries. This transparency builds trust in the data and speeds up investigation time.
How we help finance teams track KPIs across the organisation
We bring all your management information into one place where you can monitor KPI performance across every department and business unit. Our platform integrates with your existing ERP, HR, CRM, and operational systems to consolidate data automatically, giving you real-time visibility without manual consolidation work.
Here's how our solution supports organisational KPI tracking:
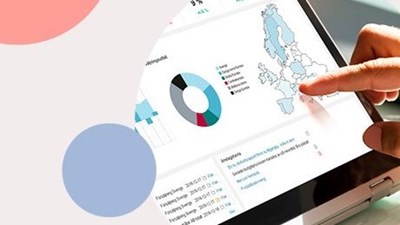
Interactive dashboards and scorecards – Present business-critical information grouped by financial, customer, process, personnel, or environmental perspectives, with visual indicators like traffic lights and speedometers that immediately highlight deviations from targets
Drill-down analysis from any level – Trace variances from summary KPIs down to individual transactions, scanned invoices, or line items with a single click, eliminating hours spent manually investigating discrepancies
Role-based views – Give CFOs, controllers, and analysts preconfigured dashboards with the metrics they need, whilst maintaining strict access controls so the right people see the right data without compromising sensitive information
Live data synchronisation – Powered by our VELOXIC database that instantly updates dashboards as new data arrives from across your business, cutting hours off reporting cycles and ensuring you're always working with current information
Integration with major ERP platforms – Connect seamlessly with SAP, Oracle, Microsoft Dynamics, IFS, Unit4 Agresso, and others to pull detailed data automatically without manual exports, reducing errors and consolidation time
Our platform transforms how finance teams monitor organisational performance by eliminating the manual data gathering, consolidation, and reconciliation work that typically consumes days of effort each reporting period. Instead of chasing down numbers from different departments and wrestling with spreadsheet versions, your team gets immediate access to accurate, up-to-date KPIs across every area of the business. This shift from data collection to data analysis means you can spend your time identifying trends, investigating variances, and providing strategic insights that drive better business decisions.
Stop spending your time gathering and consolidating data from disconnected systems. Contact us to see how we can give you complete visibility into KPI performance across your entire organisation.
 Blog
BlogHow To Create a Successful Budgeting Process
When done well, budgeting helps organisations stay financially on course, even when things don’t go exactly as planned. Learn how to keep things on track so you avoid surprises and stay focused on your goals.
 Blog
BlogAI in Finance as a Powerful Tool
In this post, we explore how AI is evolving from a theoretical concept into a valuable resource for decision-making. Get useful insights for finance teams at any stage, from early exploration to actively using AI-powered solutions.
 Blog
BlogBuild Long-Range Planning for Business Success
Discover how effective long-range planning aligns strategy, finance and operations for smarter decisions and sustainable growth.
 Blog
BlogBetter Revenue Planning
Sales forecasting is the process of predicting future revenue based on past data and trends. Read the blog to learn the best methods to do it right.
 Blog
BlogBalancing Profitability and Sustainability
Sustainability has become a central concern for organisations across the world — and the UK is no exception. This evolving landscape places new demands on financial reporting.
 Blog
BlogFP&A Trends Shaping Financial Planning in 2025
Many organisations cope with fragmented planning and data quality issues, which slow down their forecasting cycles. This forces organisations to take practical steps to turn ambition into execution.
 Blog
BlogBusiness Intelligence Reporting For Finance Teams
The real challenge today isn’t collecting data, it’s making sense of it and fast. Organisations turn to business intelligence (BI) to convert raw data into insight.But how do you actually do it right?
 Blog
BlogHow EPM Transforms Financial Planning and Forecasting
Struggling to keep plans aligned in a changing market? Discover how EPM helps finance teams move faster, stay accurate and lead with real-time insights.
 Blog
BlogSpreadsheet Risk Management: Best Practices for 2025
Excel has long been a target for hackers; just one click on a malicious attachment can infect your entire network. So, how can you keep using spreadsheets while not sacrificing your safety?
 Blog
BlogSpreadsheets Risk the Future of the Business
Spreadsheets often start as just a list for storing information and there is minimal process documentation, support or maintenance for these worksheets. Despite the fact that desktop applications such as Microsoft Office are included in the standard configuration of users' PCs, very little formal training is ever given to spreadsheet users.
 Blog
BlogThe Role of the CFO: Top Priorities and Responsibilities
Today's finance leaders steer more than just budgets and reports. The digital transformation ramps up with the increase of corporate complexity, and so does the role of CFOs.
 Blog
BlogCash Flow Forecasting
Inaccurate cash flow forecasting can be a costly mistake for companies. In today’s volatile market, relying on static annual budgets or manual spreadsheets leaves financial leaders without the agility to respond to uncertainty.
 Blog
BlogWhat Is Planning, Budgeting and Forecasting?
Planning, budgeting and forecasting are rarely static. Shifts in the industry often require you to revisit assumptions, adjust targets and adopt new processes. Learn how to strengthen your approach and stay ahead of change.
 Blog
BlogHow Automated Reporting Will Transform FP&A in 2026
This article highlights the power of report automation, how to implement it in your business and explores any new opportunities for accurate financial analysis in the long run.
 Blog
BlogWhy xP&A is a powerful game-changer
The newest iteration of planning, analysis and reporting systems is a powerful game-changer that unites company departments and boosts competitiveness. It’s called xP&A – the abbreviation of extended financial planning and analysis.
 Blog
BlogCFO Playbook - KPIs for 2026
The role of the CFO is changing fast. Today, the finance function is expected to deliver more than reports — it must drive direction, speed and profitability through clear, actionable KPIs. Learn more in this guide.
 Blog
BlogFive tips for a successful budget process!
How can you make your budget process more successful and maximise the effort that was invested in creating it? Of course, there are many factors to consider but we’ve chosen to highlight five key areas that will enable and help you create a smoother, value-creating and collaborative budget process.
 Blog
BlogMastering Spreadsheets
Where many businesses start small, a simple spreadsheet can adequately perform the limited tasks required of it. As the company grows, your spreadsheets can get more complex and harder to manage, by which point it feels like it will be too difficult to move to a different reporting tool.
 Blog
BlogWhat is management reporting?
Management Reporting refers to the process of creating, analyzing, and presenting information about various aspects of an organization's performance to enable decision-makers to make well-informed decisions about the future.
 Blog
BlogHow to succeed with your planning, budgeting, and forecasting process
We know it can be challenging to succeed with your planning, budgeting, and forecasting process. Therefore, we have gathered our best tips for you to succeed!
 Blog
BlogHow can AI help CFOs make better decisions?
Artificial Intelligence (AI) has significant potential to enhance decision-making for Chief Financial Officers (CFOs) by providing data-driven insights, automating routine tasks, and enabling more accurate forecasts.
 Blog
BlogBusiness Budgeting Software: How to Choose the Right One
Choosing budgeting software is partly a finance and partly a strategic decision. The right tool helps organisations organise planning cycles, adapt as the market changes and increase accountability across departments. But not every platform will be a good fit.
 Blog
BlogScenario Planning - Better control during uncertain times
Uncertain times create the need for more frequent forecasts and time for analyzing and comparing different future scenarios. We give you 5 tips on how to simulate future scenarios using scenario planning
 Blog
BlogBoost Report Readability, Engagement, and Decision-Making
In today’s fast-paced business environment, effective reports and dashboards are crucial for decision-making. Our user study using eye-tracking technology revealed seven key insights into what captures attention.
 Blog
BlogManagement Reporting Guide: Definition and Tips
Management reporting helps you see what’s really happening in your business. In this guide, we’ll explain what managerial reporting looks like and share practical tips.
 Blog
BlogA practcial guide to scenario planning
Scenario planning gives you a clear, practical way to test assumptions, spot risks and opportunities, and make better strategic choices so your organisation stays resilient when conditions change.
 Blog
BlogRolling Forecasts: Practical Steps, Benefits, and How to Get Started
Financial planning has changed. Traditional annual budgets can’t keep up with rapid shifts in the market, evolving customer needs, and internal performance dynamics. That’s why many finance teams are turning to a rolling forecast model.
 Blog
Blog3‑Statement Model for Better Financial Forecasting
Financial forecasting is critical for any business that wants to adapt to change. But finance teams keep usingfragmented models and manual processes. The 3-statement financial model is the solution.
 Blog
BlogWhat is Corporate Performance Management? (CPM)
CPM, or Corporate Performance Management, is a process within corporate management aimed at measuring and optimizing the performance of an organization. CPM encompasses a range of activities, including budgeting, planning, forecasting, reporting, and analysis.
 Blog
BlogAI in Financial Planning: Trends and Next Steps
Discover how finance teams are using AI to drive smarter planning, faster insights, and stronger business decisions.
 Blog
BlogThe Collaborative, Smarter Budget
In many organisations manual budgeting processes over-burden staff and create masses of data which overwhelms department heads and stops them seeing the bigger picture.
 Blog
BlogThe Hidden Cost of Data Silos
If you ever feel like your teams speak different languages when it comes to data, it is a classic symptom of data silos. The information gets stuck in one department, system or tool, making it difficult for anyone to see the full picture.
 Blog
BlogSave time and create a successful budget process
If you’re working in a large organization, you’re probably aware of how time-consuming the budget process can be. In this article we’ll give you tips on how to save time and still create a successful budget process
 Blog
BlogFrom static budgets to agile financial management
Traditional budgeting has long been the cornerstone of financial planning in businesses. But today it can become more of a limitation than a strength. That’s where the concept of Beyond Budgeting comes in.
 Blog
BlogTop PowerBI Alternatives in 2025
Explore the top PowerBI alternatives for 2025. Discover how Mercur delivers integrated planning, budgeting and reporting without the high cost and complexity.
 Blog
BlogTop-Down vs Bottom-Up Budgeting
Budgeting aligns resources with strategic goals, and there are two primary approaches: top-down and bottom-up. Which method wroks best?
 Blog
BlogWhat Is FP&A? Definition, Purpose, and Best Practices
Without solid financial planning and analysis (FP&A), businesses operate in the dark. In this post we go deeper into the process of FP&A and why it’s important for businesses.
 Blog
BlogThe Powerhouse of EPM Tools
A business’s success heavily relies on having a strong strategy. However, what's even more important is implementing that strategy while tracking and measuring the performance. This can easily be done by investing in enterprise performance management (EPM) software.
 Blog
BlogHow to Effectively Budget with Driver-Based Forecasting
Traditional models of forecasting rely on historical data and beliefs. It uses techniques that identify patterns, which are simple to use. However, with these methods, there are some challenges because they are not dynamic with today’s market, and can’t effectively analyse complex data.
 Blog
BlogWhy is our Excel-based budget always out of date?
Excel creates outdated budgets. Every time someone enters a figure, sends a file, or waits for another department to finish their section, your budget falls further behind reality.
 Blog
BlogAI in corporate budgeting
Artificial Intelligence (AI) can support decision making in key areas such as budgeting, capital allocation and even corporate strategy and as a result, it is increasingly being deployed in corporate performance management tools (CPM).
 Blog
BlogZero-Based vs. Incremental Budgeting
Budgeting sits at the heart of sound financial management. This is why choosing the right technique is crucial for CFOs – it shapes resource allocation, cost control and strategic agility. Incremental and zero-based budgeting are two leading methods that offer distinct approaches.
 Blog
BlogThe Business Benefits of Integrated Business Planning
This blog explores what IBP is and the typical IBP process. We highlight business benefits and how the right software can be a game-changer for your organisation.
 Blog
BlogAI and Machine Learning, what is it, and why is it important for the future?
Artificial Intelligence and Machine Learning, what is it, and what is the difference?
 Blog
BlogSpreadsheets are not Collaborative Tools
Spreadsheets were never designed for collaboration, yet they are the single most used program among teams and co-workers. They often start out as a quick document for storing, formatting or calculating information but evolve into important documents and are often the core records for an organisation.
 Blog
BlogBest Guide to Improve Your Revenue with Flexible Budgeting
Optimise your expenses with flexible budgeting, and learn how to adjust budget to reflect current business activities, market changes and cost fluctuations.
 Blog
BlogVariance Analysis: A Comprehensive Guide
Senior executives are demanding more detail in their management reports. The amount of data available to finance departments has exploded and decision makers see this as an opportunity to get more insight into how the business is performing.
 Blog
BlogBudgeting in a modern world
Thirty years after its debut, Microsoft Excel is still the preferred tool for budgeting and planning projects. However, its popularity is declining, due in most part to the rise of technology and subscription-based pricing for a myriad of SaaS-based products.
 Blog
BlogInformed Business Decisions at Maximum Velocity
The ability to process information swiftly is essential. If your business can’t manage your data efficiently, your company’s financial performance will surely underperform. At Mercur we have developed our own database Veloxic which helps Financial Planning and Analysis.
 Blog
BlogHow to get accurate financial reports without waiting for month-end
You don't need to wait until month-end to see accurate financial reports. With modern financial systems you can access up-to-date reports whenever you need them.
 Blog
BlogTop 7 Manager KPIs for Financial and Operational Success
In today's post we'll break down why KPIs matter, which ones offer the most insight for finance and executive teams and how to ensure they're actually driving results.
 Blog
BlogRisks with working in spreadsheets
Spreadsheets are an essential tool for all types of organisations and businesses rely on them heavily, particularly for financial computations. The most popular spreadsheet program globally is, of course, Microsoft Excel, it’s used by an estimated 750 million people.

